Population
at a Glance
Population
is based on three main factors; births, deaths, and migration. The equation to figure out the change in
population is: (Births + Immigration) –
(Deaths + Emigration).
The graphs below represent the average crude birth rates and average
crude death rates in the developed and developing countries in the
world.
a. 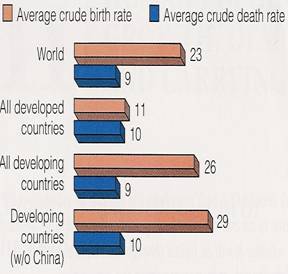 b.
b. 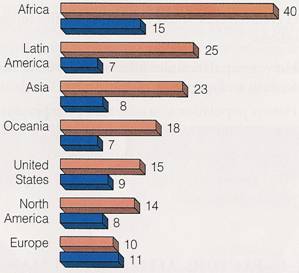
Figures above shows the number of live births per 1000 people in
a population in a given year and the number of deaths per 1000 people in a
population in a given year.
The United Nations (UN), an accepted
authority on population levels and trends, estimates that the world population
reached 6 billion in 1999, and is increasing annually by more than 77 million
persons. The world is reaching its carrying
capacity (K), which is the number of individuals of a given species that
can continually exist in a given space and time, and will soon be affected by
this by it going through destruction.
Population grows exponentially and logistically. Exponential growth is when the population
grows faster with time and is never ending, until the resources in a given area
are all used up. Logistic growth is when
the growth rate decreases as the population gets larger so the population size
stabilizes at the carrying capacity.
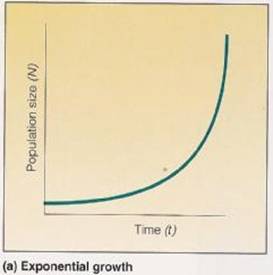
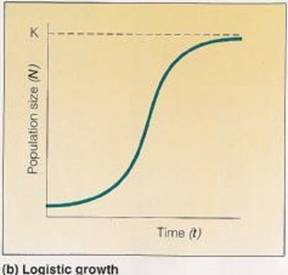
Figure
above shows the Exponential and Logistic growth of a population size.
A population can overshoot the
carrying capacity by having the births rise faster than the deaths. If this happens, the population with suffer a
“dieback” or “crash”. The population
will suddenly deteriorate to a very low size.
An example of this would be 10 elk (8 being females) being introduced to
a new environment. They mate and the
population rises to 1000 elk which is way over the carrying capacity for the
given environment. The resources they
need to live will diminish to wear they cannot live comfortably, which
ultimately may also lead to extinction.
These are the density-dependent population controls. It depends on the limited resources that are
in the environment for the population size.
So the population of the elk decreases back to the starting population
where they have enough resources to live.
Density-independent population controls could also have an affect
on the population size because natural disasters like tornadoes, floods,
earthquakes, etc… can occur within an environment. These processes continue like this over and
over again. There’s no stopping natural
disasters, but something could be done by limiting the amount of animals that
are created.
Click
here for the World Population Clock.
The rate of increase, 1.3 percent per
year, has fallen below the peak rate of 2 percent per year attained by 1970. By
the late 2040s, the UN estimates, the growth rate will have fallen to about
0.64 percent annually, at which time more than 50 countries will experience
negative growth. The population of
the world was about 300 million in the year AD 1, and it took more than 1,500
years to reach the 500 million mark.
Nowadays, the population is increasing very rapidly.
|
Some past disasters |
Approximate |
Present World population growth |
|
|
# of deaths |
replaces this # in approximately |
|
|
|
what time span? |
|
|
|
|
|
All |
93,300 |
9.8 hours |
|
Bangladeshi
cyclone, 1991 |
140,000 |
14.7 hours |
|
Total
American deaths in all wars |
600,000 |
2.6 days |
|
Great flood, |
900,000 |
3.9 days |
|
Total |
2,600,000 |
11.4 days |
|
|
3,000,000 |
13.1 days |
|
Total AIDS
dead through 1996 |
6,400,000 |
27.9 days |
|
|
9,500,000 |
41.5 days |
|
Influenza
epidemic, 1918 |
21,000,000 |
91.7 days |
|
Global deaths
in all wars in the past 500 years |
35,000,000 |
152.8 days |
|
Bubonic
plague, 1347-51 |
75,000,000 |
327.5 days |
Figure above is a listing of some of the world’s
worst disasters, along with an approximate death toll and how long it will take
to replace the # of deaths.
Click
here for World Vital Events per Time Unit.
Growth was not steady but the climate,
food supply, disease, and war were all contributors. Many improvements by the beginning of the
1950s including water supply, sewage-disposal facilities, and transportation
networks, agricultural yields increased, and deaths from infectious and
parasitic diseases greatly declined.
Life expectancy at birth in most developing countries increased from
about 35-40 years in 1950 to 66 years by 2000.
The rapid decline in deaths among people who maintained generally high
fertility rates led to annual population growth that exceeded 3.1 percent in
many developing nations. This rate
doubles population size in 23 years. As of 2000, 1.2 billion people lived in the developed nations of
the world, and 4.9 billion people lived in the less-developed countries.
Click
here to see how many people were on Earth when you were born.
Projections issued in 2000 show the world
population increasing from 6.1 billion in 2000 to 7.9 billion in 2025 and 9.3
billion in 2050. “High” and “low” projections for 2025 are 8.4 billion and 7.5
billion respectively. The average world birth rate is projected to decline from
the 2000 level of 22 per 1,000 to 17.6 per 1,000 in 2025. Because of the expanding share of the
population at high-mortality ages, the average world death rate is expected to
decline only slightly. Average world
life expectancy, however, is projected to rise from 65 years in 1990 to 71.3
years in 2025.
Copywrited by Brian Smith